LIVE TRADES EXAMPLES FOR LEARNING
June 23, 2024 2024-06-29 11:21LIVE TRADES EXAMPLES FOR LEARNING
Disclaimer
The information provided here is for educational purposes only and does not constitute financial advice. We are not registered with the Securities and Exchange Board of India (SEBI) and are not licensed financial advisors. Trading in financial markets involves risk, and you should consult with a qualified financial advisor before making any investment decisions. Past performance is not indicative of future results. Any trades or strategies mentioned here are for illustrative purposes only and may not be suitable for your individual circumstances. Use this information at your own risk.
Only members who have joined our course can view trades in the live market.
OR
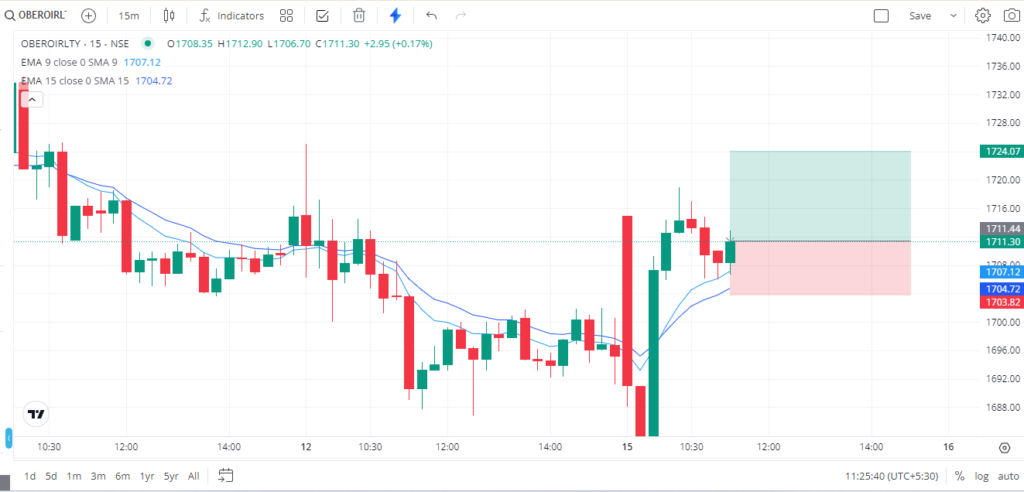
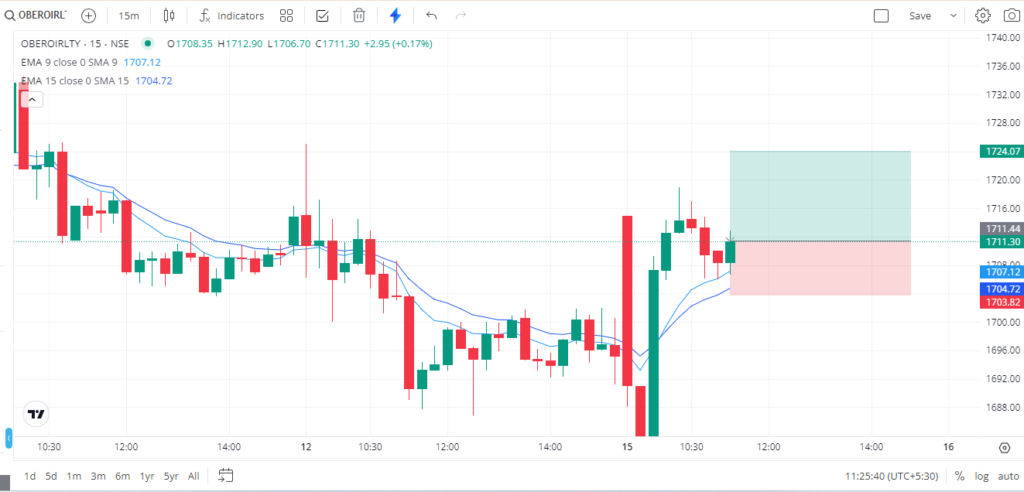
Ye chart 15-minute candlestick chart hai OBEROIRLTY ka, jo NSE (National Stock Exchange of India) par trade ho raha hai. Is chart ko detail me samajhte hain:
Chart ke Elements:
- Candlesticks: Har candlestick 15-minute me stock ke price movement ko dikhata hai. Green candlesticks ka matlab hai ki closing price opening price se zyada thi, aur red candlesticks ka matlab hai ki closing price opening price se kam thi.
- Moving Averages:
- 9 EMA (Exponential Moving Average): Ye blue line hai jo recent prices par zyada weightage deti hai.
- 15 SMA (Simple Moving Average): Ye doosri blue line hai jo recent 15 periods ka average dikhati hai.
- Pin Bar Support on 9 EMA:
- Pin bar wo candlestick hai jiska long wick hota hai aur chhota body. Is chart me, pin bar 9 EMA par support dikhata hai. Matlab, price ne 9 EMA ko touch kiya aur wapas upar gaya, jo support level ko confirm karta hai.
Chart ka Analysis:
- Entry Point: Jo pin bar 9 EMA par support dikha raha hai, usko trading strategy me entry point ke liye use kiya ja sakta hai. Pin bar ke baad price upar gaya hai.
- Stop Loss: Jo red shaded area hai, wo stop loss level ko dikhata hai, jo pin bar ke neeche set kiya gaya hai.
- Target: Jo green shaded area hai, wo target price level ko dikhata hai.
Summary:
- Pin bar 9 EMA par support dikha raha hai, jo potential bullish signal hai.
- Entry point pin bar ke baad ka candle close ho sakta hai.
- Stop loss pin bar ke neeche set kar sakte hain.
- Target upar green shaded area ke around set kar sakte hain.
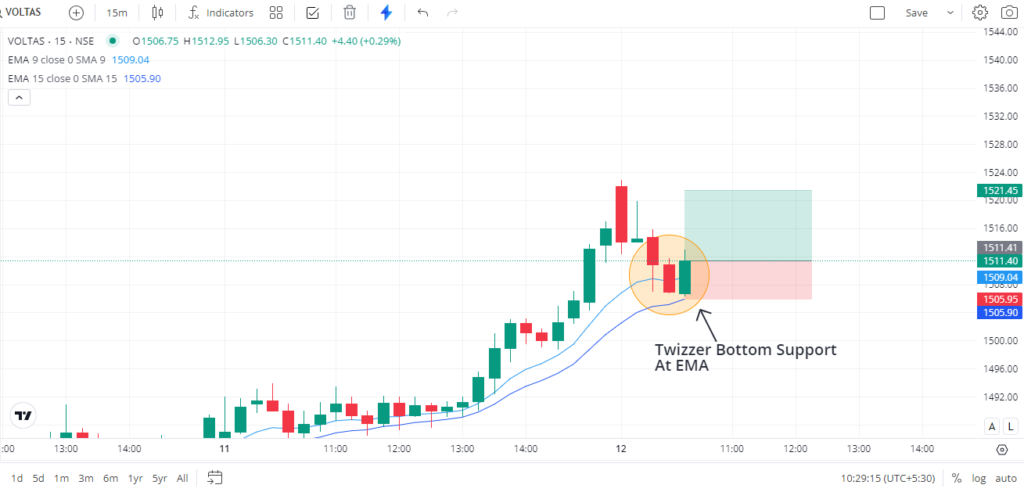
Yeh chart VOLTAS stock ka 15-minute interval par movement dikhata hai. Isme kuch important cheezein hain:
- EMA 9 aur EMA 15: Yeh dono exponential moving averages hain. EMA 9 ka value 1508.54 aur EMA 15 ka value 1505.59 hai.
- Twizzer Bottom Support: Yeh ek reversal pattern hota hai jo yeh indicate karta hai ki price niche se upar ja sakta hai. Is chart mein yeh pattern EMA ke support par form ho raha hai, jo ek bullish signal hai.
- Green aur Red Candles: Yeh candlesticks price ki movement ko dikhati hain. Green candle matlab price increase hua hai, aur red candle matlab price decrease hua hai.
- Price Levels: Chart mein price levels bhi diye gaye hain. Current price 1508.90 hai, jo thoda sa upar hai open price 1506.75 se.
- Indicators aur Annotations: Yeh chart TradingView platform ka lagta hai kyunki niche left corner mein uska logo hai. Annotations se clear hota hai ki yeh chart ko analyse karne ke liye use kiya gaya hai.
Overall, yeh chart yeh indicate kar raha hai ki VOLTAS ka price EMA ke support par Twizzer Bottom pattern banane ke baad upar ja sakta hai.
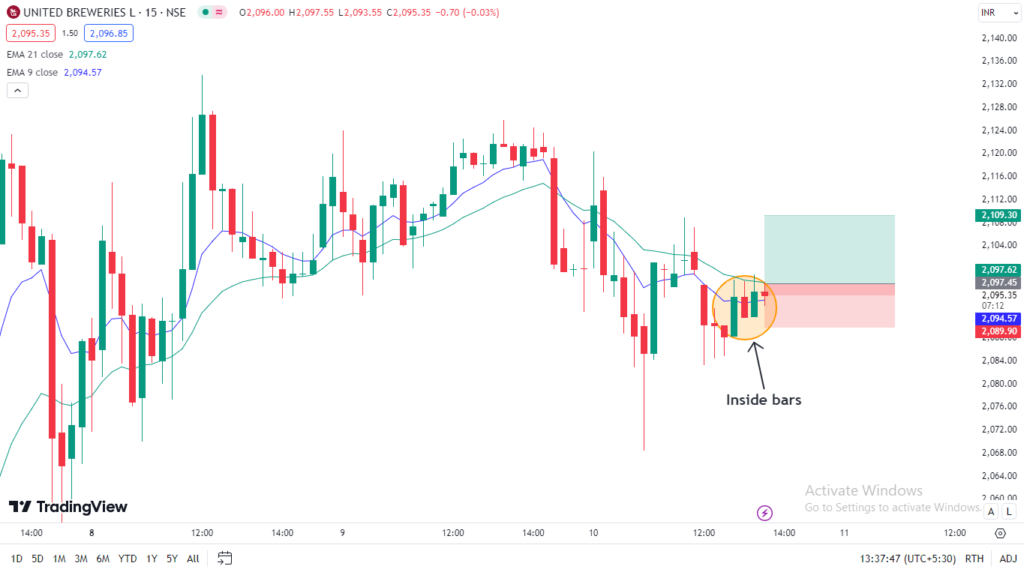
Yeh chart TradingView par United Breweries ke stock ka 15-minute interval ka chart hai. Isme kuch important cheezen highlighted hain:
- Candlesticks: Har ek candle 15 minute ka price movement show karti hai. Green candles price rise ko aur red candles price fall ko show karti hain.
- EMAs (Exponential Moving Averages): Chart par 21-period EMA (green line) aur 9-period EMA (blue line) dikhayi de rahi hain. EMA price ka average hota hai jo recent prices ko zyada weightage deta hai. Yeh trends ko identify karne me madad karti hain.
- Inside Bars: Chart me ek orange circle ke through inside bars highlight kiye gaye hain. Inside bars tab bante hain jab current candle ka high aur low pichle candle ke high aur low ke andar hota hai. Yeh consolidation ya market me pause ko indicate karta hai.
- Price Levels: Upar left corner me, current price INR 2094.15 show ho raha hai. High, low aur close prices bhi dikhayi de rahe hain.
- Potential Trade Setup: Inside bars ke pass ek highlighted area hai jo potential trade setup ko indicate karta hai. Green region target price aur red region stop loss ko show karta hai.
Yeh chart technical analysis ke liye use hota hai jisme traders different indicators aur patterns ko analyze karke trading decisions lete hain.
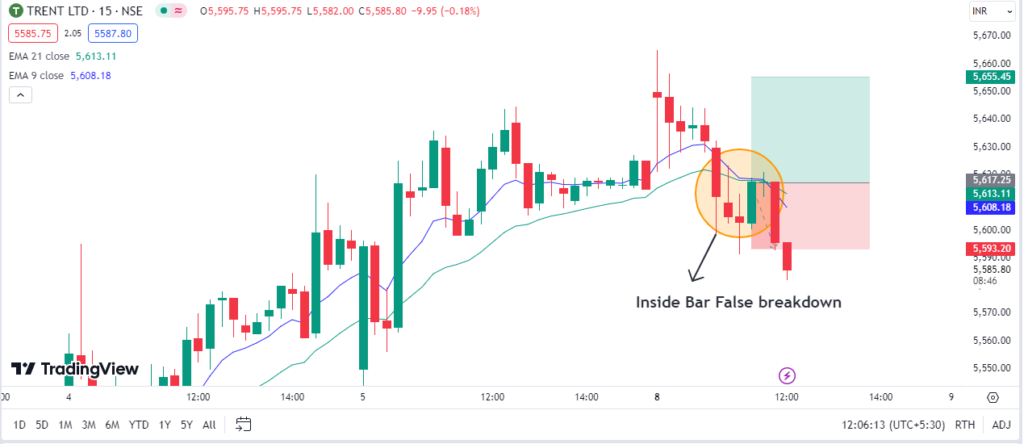
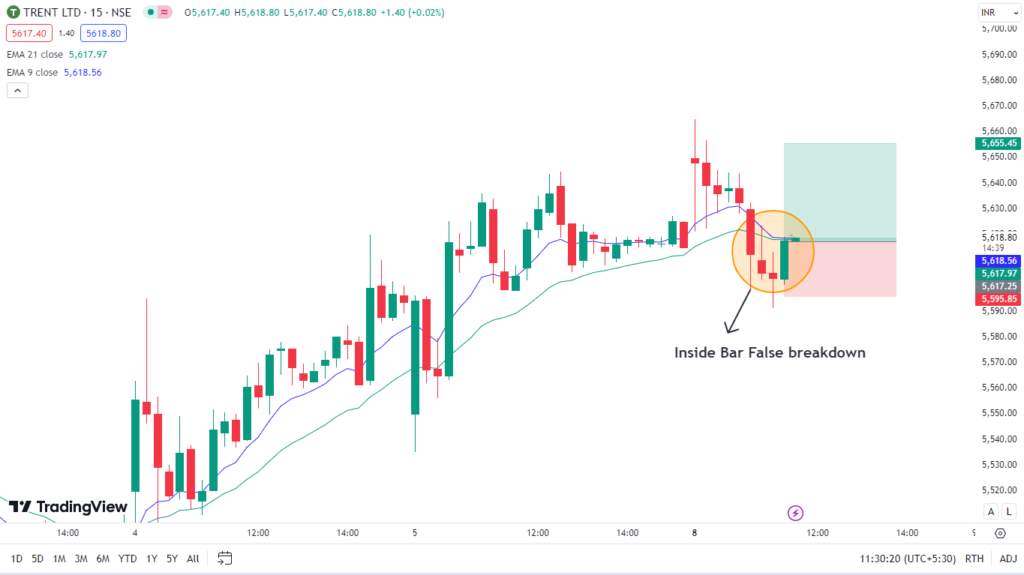
Yeh chart TradingView platform par dikhaya gaya hai aur yeh 15-minute timeframe par Trent Ltd. ka stock price movement dikha raha hai. Chart me kuch important indicators aur patterns highlight kiye gaye hain:
- EMA (Exponential Moving Average):
- EMA 21 close (blue line) aur EMA 9 close (purple line) dikhayi gayi hain. EMA 21 ka value 5617.99 aur EMA 9 ka value 5618.59 hai.
- Yeh moving averages stock ke price ke short-term aur mid-term trend ko indicate karte hain.
- Candlestick Patterns:
- Candlestick chart price ke movement ko dikhata hai jahan green candles price increase ko aur red candles price decrease ko show karte hain.
- Inside Bar False Breakdown:
- Orange circle ke andar ek “Inside Bar False Breakdown” pattern highlight kiya gaya hai.
- Inside Bar ka matlab hai ki current candle ka high aur low previous candle ke high aur low ke andar hai.
- False Breakdown ka matlab hai ki price temporarily support level ke neeche break karta hai, lekin phir wapas uske upar close karta hai, jo potential bullish reversal ko indicate karta hai.
- Price Levels:
- Chart par kuch key price levels bhi show kiye gaye hain:
- 5617.45: Red color me, yeh shayad current or recent support level ho sakta hai.
- 5618.80: Blue color me, yeh shayad current price ya resistance level ho sakta hai.
- 5617.99: EMA 21 close ka value.
- 5618.59: EMA 9 close ka value.
- 5617.25: Current trading level ke aas-paas ka value.
- 5595.85: Yeh shayad stop loss level ho sakta hai.
- 5655.45: Yeh shayad target level ho sakta hai.
- Chart par kuch key price levels bhi show kiye gaye hain:
Chart ke niche time aur date bhi mentioned hai, jo 11:30:34 (UTC+5:30) ka hai.
Is chart ke basis par, yeh lagta hai ki ek potential buying opportunity ho sakti hai, jahan trader “Inside Bar False Breakdown” pattern ko dekh kar trade initiate kar sakta hai, target aur stop loss levels ko dhyan me rakhte hue.
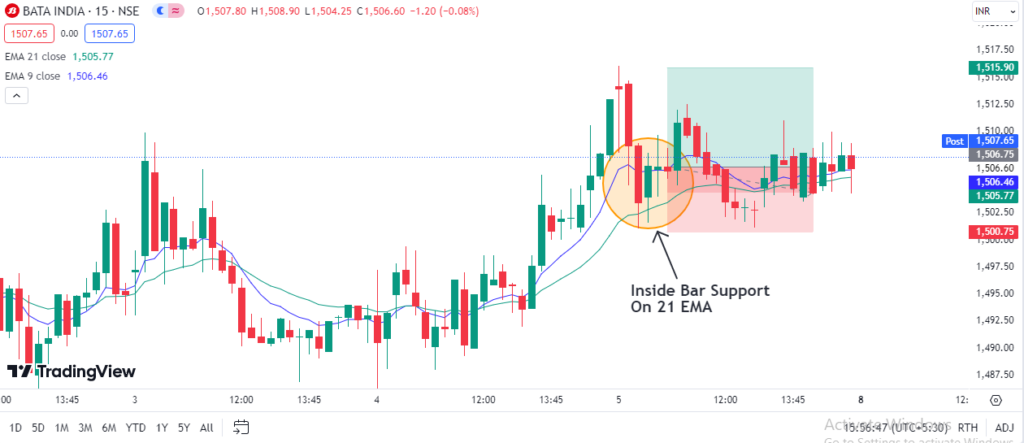
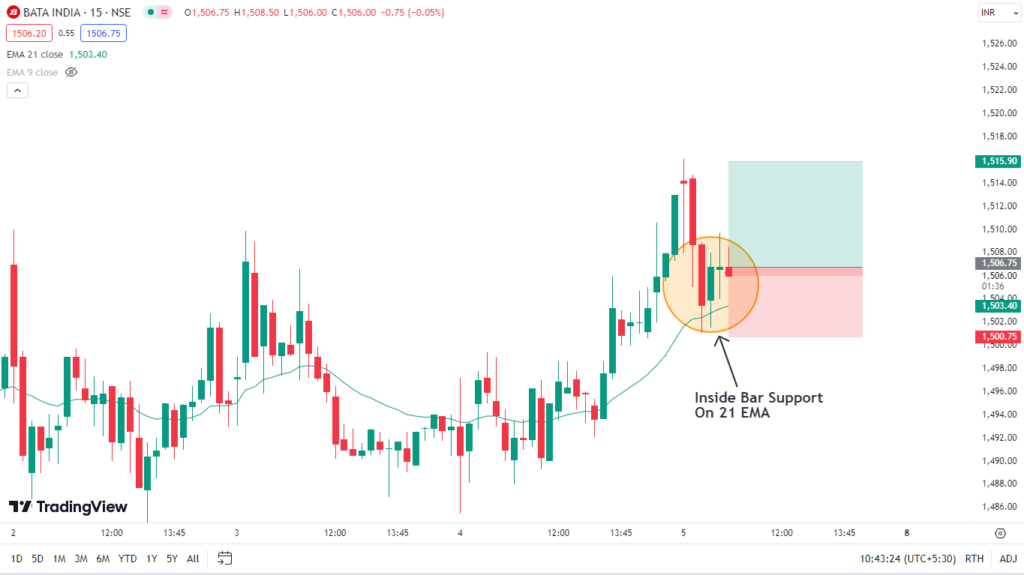
Yeh chart Bata India stock ka hai jo 15-minute time frame par dikhaya gaya hai. Chart par kuch key points hain jo hum samajh sakte hain:
- EMA 21: Yeh green line chart par 21-period Exponential Moving Average (EMA) ko dikhati hai. Yeh ek technical indicator hai jo stock ke average price ko last 21 periods mein smooth karke dikhata hai.
- Inside Bar: Yeh circled area ek inside bar pattern ko dikhata hai jo 21 EMA ke upar support kar raha hai. Inside bar tab banta hai jab current candle ka high aur low pichhli candle ke high aur low ke andar ho.
- Support Level: Yeh chart par 21 EMA ke paas inside bar ko support level bataya gaya hai, jiska matlab hai ki yeh level stock ke price ko niche girne se rok raha hai.
- Entry and Stop-Loss: Yeh chart ek hypothetical trading setup bhi dikhata hai. Green box potential profit (target) area ko dikhata hai aur red box stop-loss area ko dikhata hai. Entry point us inside bar ke upar ho sakta hai aur stop-loss inside bar ke neeche set kiya gaya hai.
- Candlestick Patterns: Chart par candlestick patterns price action ko dikhate hain. Green candles price increase ko dikhati hain aur red candles price decrease ko.
Summary mein, yeh chart ek potential trading setup ko highlight karta hai jo inside bar aur 21 EMA par based hai.
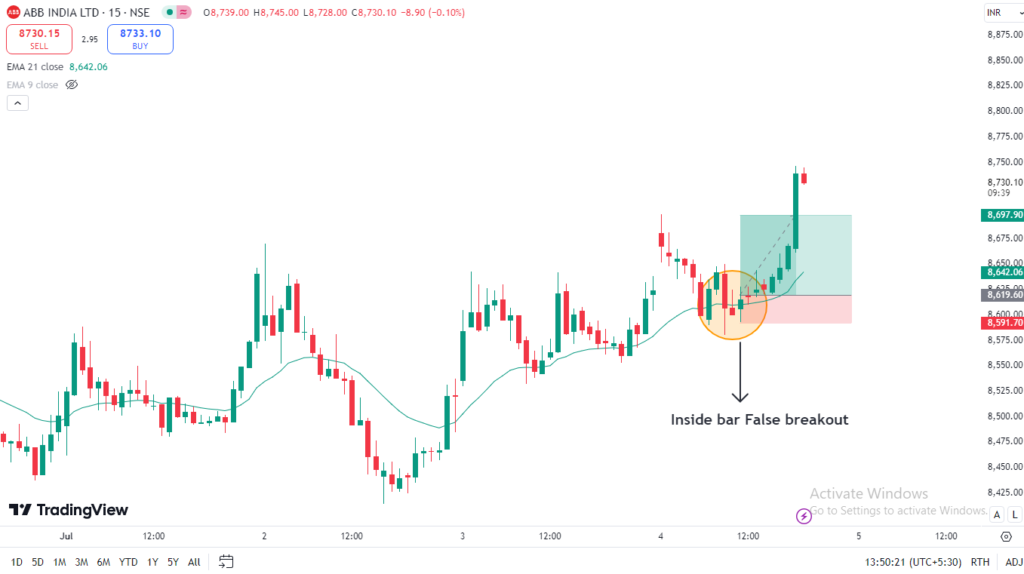
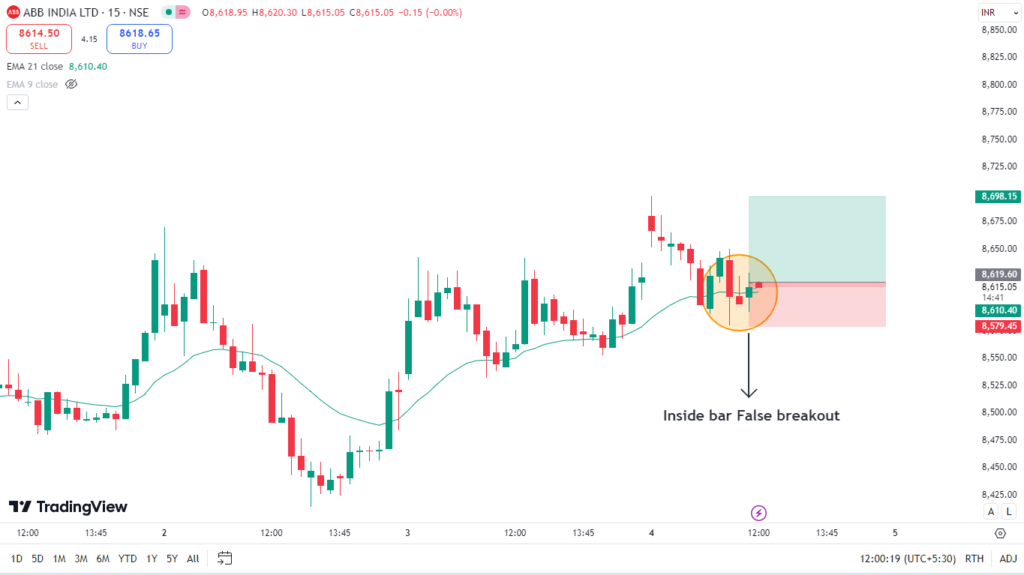
Yeh chart ABB India Ltd ka 15-minute time frame par dikhaya gaya hai. Chart par kuch important points hain:
- Inside Bar False Breakout: Yeh indicate karta hai ki jo candle highlighted hai (circle ke andar), woh inside bar thi. Inside bar ka matlab hota hai ki yeh candle apne previous candle ke high aur low ke beech mein hai. False breakout ka matlab hai ki yeh candle ne pehle breakout karne ki koshish ki, par phir fail ho gaya aur wapas us range mein aa gaya.
- EMA 21 aur EMA 9: Yeh chart par two exponential moving averages (EMAs) dikhaye gaye hain. EMA 21 (green line) aur EMA 9 (light grey line). EMA moving average ka ek type hai jo recent prices ko zyada weight deta hai.
- Price Movements: Current price 861586158615 dikhaya gaya hai. Chart ke top par high, low, aur opening prices bhi mention hain (O, H, L, C – Open, High, Low, Close).
- Entry/Exit Signals: Yeh chart potential entry aur exit points ko highlight karne ke liye use ho sakta hai. False breakout ek aisa point ho sakta hai jahan traders apne trades ko adjust karte hain.
Chart analysis se yeh pata chalta hai ki price ne ek false breakout banaya, aur phir wapas inside bar range mein aa gaya. Traders isko apne trading strategies mein consider kar sakte hain.
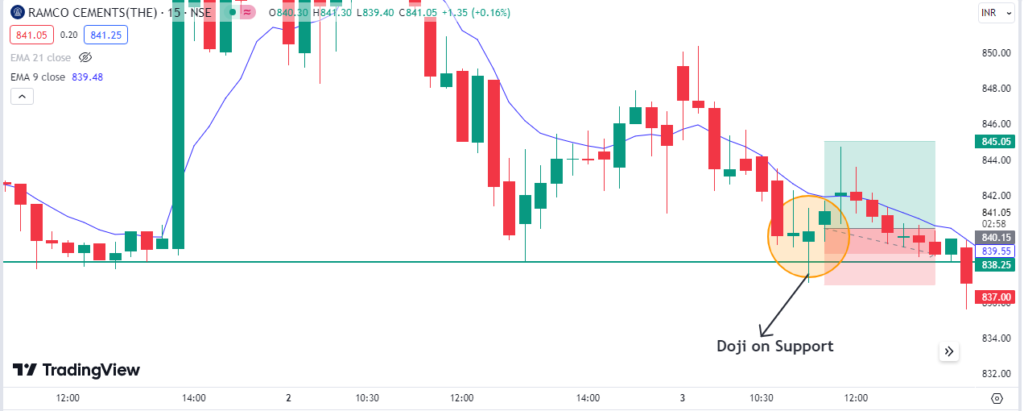
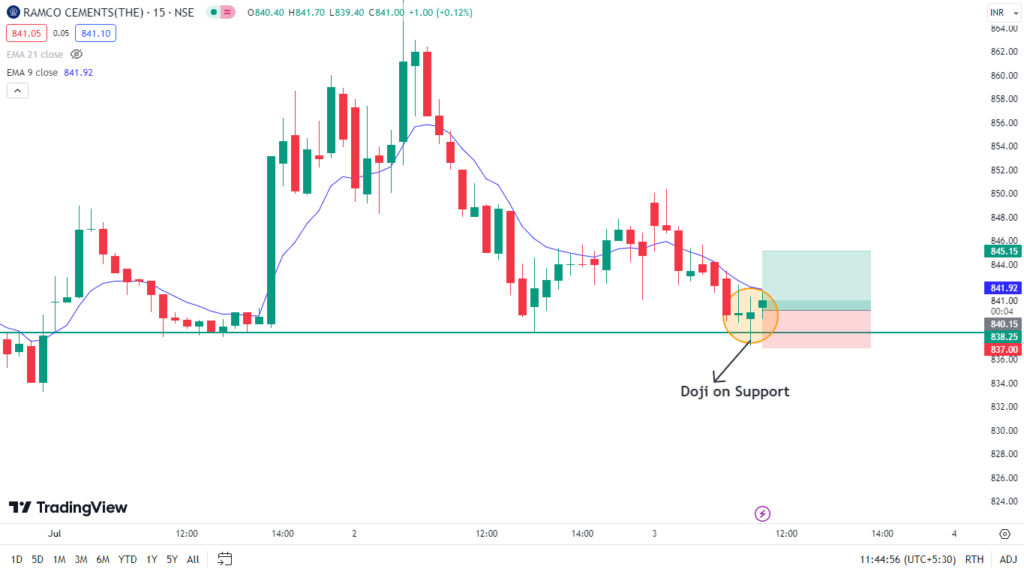
Yeh chart Ramco Cements ka hai, jismein 15-minute ka timeframe dikhaya gaya hai. Chart par ek doji candlestick support level par bani hui hai, jo circle mein highlight ki gayi hai.
Chart ka analysis:
- Doji on Support:
- Yeh candlestick doji pattern ban rahi hai, jo signify karta hai ki market mein indecision hai. Doji ka matlab hota hai ki opening aur closing price lagbhag same hoti hai.
- Yeh doji support level par bani hui hai, jo indicate karta hai ki yahan se price reversal ho sakta hai.
- Moving Averages:
- EMA 9 (blue) – 841.81 par
- EMA 21 (grey) – 841.40 par
Abhi price EMA 9 aur EMA 21 ke aas-paas hai, jo thoda indecisive situation dikhata hai.
- Trade Setup:
- Entry: Doji ke upar ek bullish candle form hone par buy karna chahiye.
- Target: Target 845.15 (upper green box) par set kiya gaya hai.
- Stoploss: Stoploss 837.00 (lower red box) ke neeche set kiya gaya hai.
Is setup mein risk-reward ratio dikhaya gaya hai, jismein green area reward ko dikhata hai aur red area risk ko.
Agar aap is pattern par trade karna chahte hain, to aapko price movement par nazar rakhni chahiye aur confirmation candle ka wait karna chahiye.
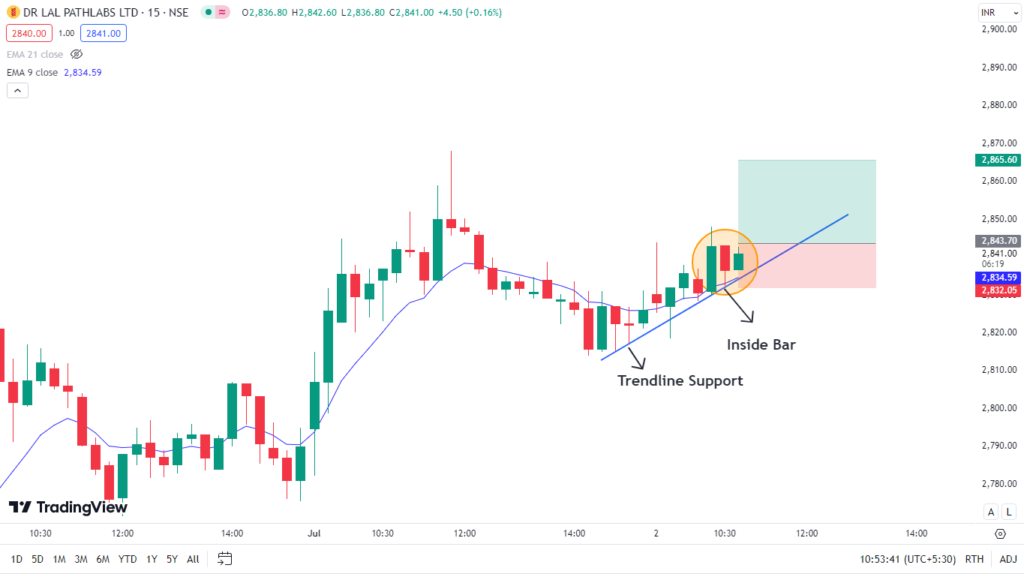
Ye chart Dr. Lal PathLabs Ltd ka 15-minute time frame chart hai jo TradingView platform pe banaya gaya hai. Isme kuch important technical indicators aur patterns highlight kiye gaye hain:
- Trendline Support: Chart ke niche se ek blue trendline draw ki gayi hai jo price ke multiple points ko connect kar rahi hai. Ye trendline support ko indicate karti hai, jaha price ne support liya hai aur fir upar move kiya hai.
- Inside Bar: Chart ke center ke thoda right side me ek orange circle ke andar ek inside bar dikh raha hai. Inside bar wo candle hoti hai jo puri tarah se previous candle ke range me hoti hai. Ye consolidation aur potential breakout ka indication hota hai.
- Entry, Stop Loss, and Target Zones: Chart ke right side me ek green aur red box dikh raha hai. Green box potential target zone ko indicate karta hai aur red box potential stop loss zone ko. Entry point wo jagah hai jaha price current level pe trade kar raha hai (approximately 2843.70).
- EMA 9 (Exponential Moving Average): 9-period EMA ko blue line se represent kiya gaya hai, jo current level pe 2834.51 hai.
- EMA 21 (Exponential Moving Average): 21-period EMA ko gray line se represent kiya gaya hai, jo is chart me hidden hai (visible nahi hai).
Summary: Is chart pe, ek trader ne trendline support aur inside bar identify kiya hai, aur uske basis pe trade setup banaya hai jisme entry, stop loss, aur target levels define kiye gaye hain.
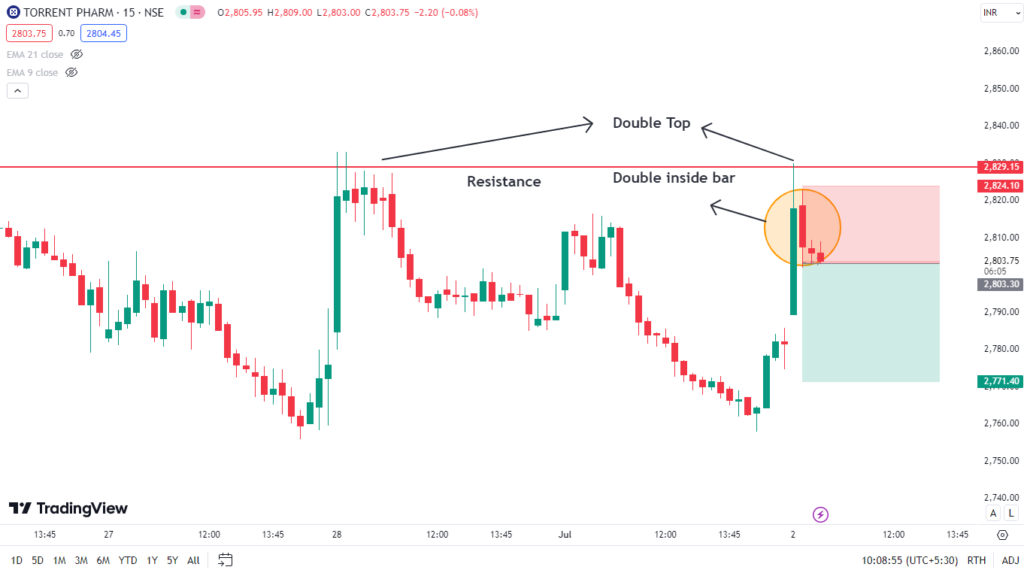
Is chart mein Torrent Pharma ke stock ki price ko 15 minute ke interval par dikhaya gaya hai. Yeh NSE (National Stock Exchange) ka data hai.
- Double Top: Chart ke upar do baar price resistance level ko touch karke neeche aayi hai, jo double top pattern ko dikhata hai. Double top ek bearish reversal pattern hai, jo dikhata hai ki price do baar upar jaane ke baad neeche girti hai.
- Resistance: Red line resistance level ko dikhati hai, jahan price upar jaane mein mushkil ka samna karti hai.
- Double Inside Bar: Yeh ek candlestick pattern hai jo dikhata hai ki market mein consolidation ho raha hai, aur price do choti candlesticks ke beech mein bandh ho gayi hai.
Is chart mein double inside bar ke sath ek trade setup bhi dikhaya gaya hai:
- Stop Loss: Upper red shaded area jo 2829.15 ke upar hai, stop loss ka level hai.
- Entry Point: Price ke double inside bar ke neeche break hone par entry ho sakti hai.
- Target: Lower green shaded area jo 2771.40 ke aas-paas hai, target price ka level hai.
Yeh suggest karta hai ki agar price double inside bar ke neeche break karti hai, to ek bearish move ho sakta hai jahan target price 2771.40 ho sakta hai aur stop loss 2829.15 ke upar set kiya gaya hai.
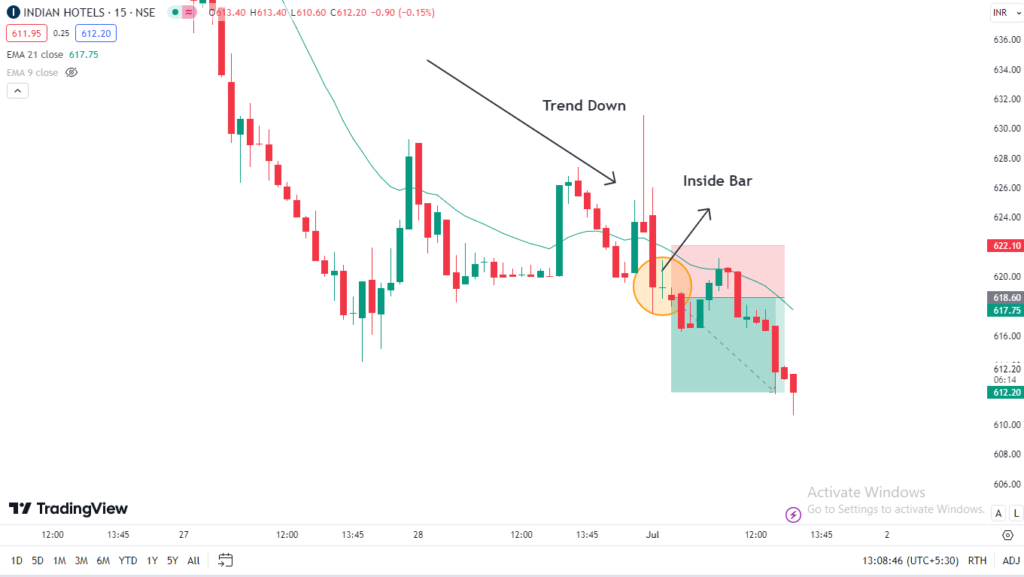
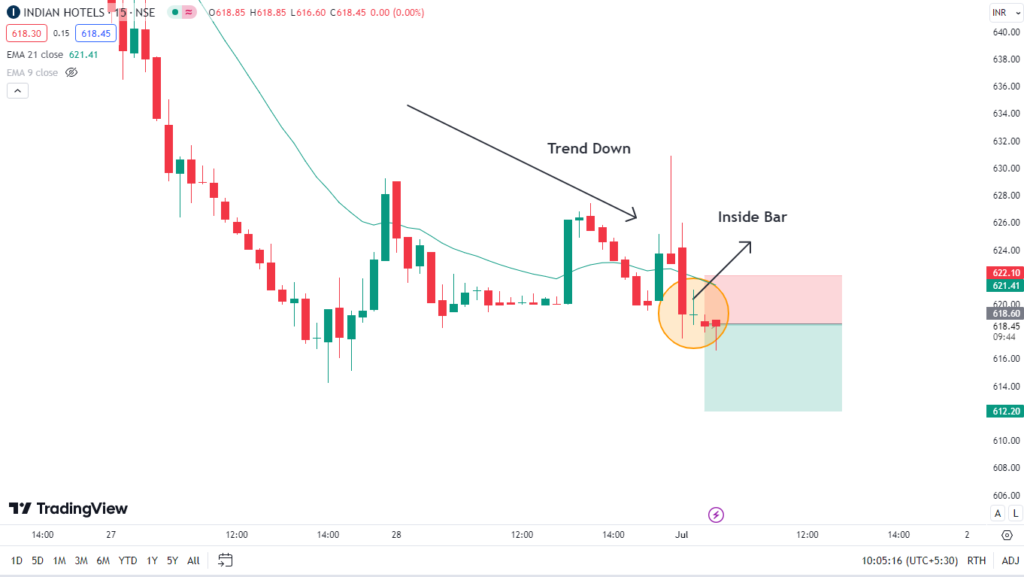
Yeh chart Indian Hotels Ltd ke 15-minute time frame ko dikhata hai. Chart pe kuch important cheezein highlight ki gayi hain:
- Trend Down: Price mein ek downward trend dekhne ko mil raha hai, jo continuous lower highs aur lower lows se indicate hota hai.
- Inside Bar: Downward trend ke baad ek inside bar bana. Inside bar ka matlab hai ki current candle ka high aur low previous candle ke high aur low ke beech hai. Yeh consolidation ya market indecision ko dikhata hai.
Chart pe exponential moving averages (EMAs) bhi dikhai de rahe hain:
- EMA 21 (Green Line): Price ke upar hai, jo bearish bias ko dikhata hai.
- EMA 9 (Red Line): Short-term trend ko follow karta hai aur price ke niche hai.
Chart pe upar aur niche shaded areas bhi dikhaye gaye hain jo potential profit (green) aur loss (red) zones ko represent karte hain. Yeh trade setup ka ek visual representation hai, jahan green area potential target hai aur red area stop-loss hai.
In summary, yeh chart ek bearish setup ko dikhata hai jahan trend down aur inside bar candles nazar aa rahi hain, jo potential downward move ko indicate karte hain.
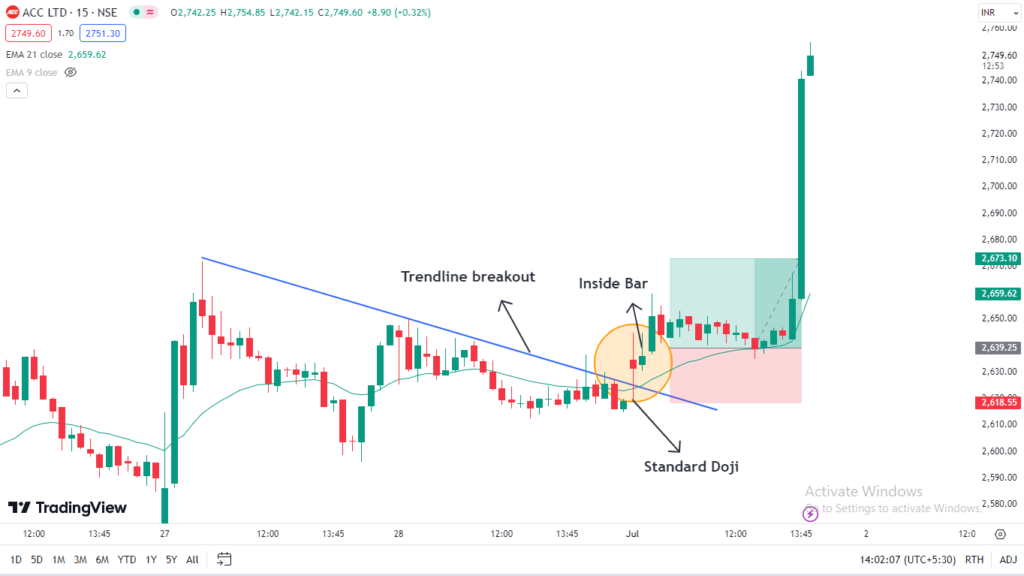
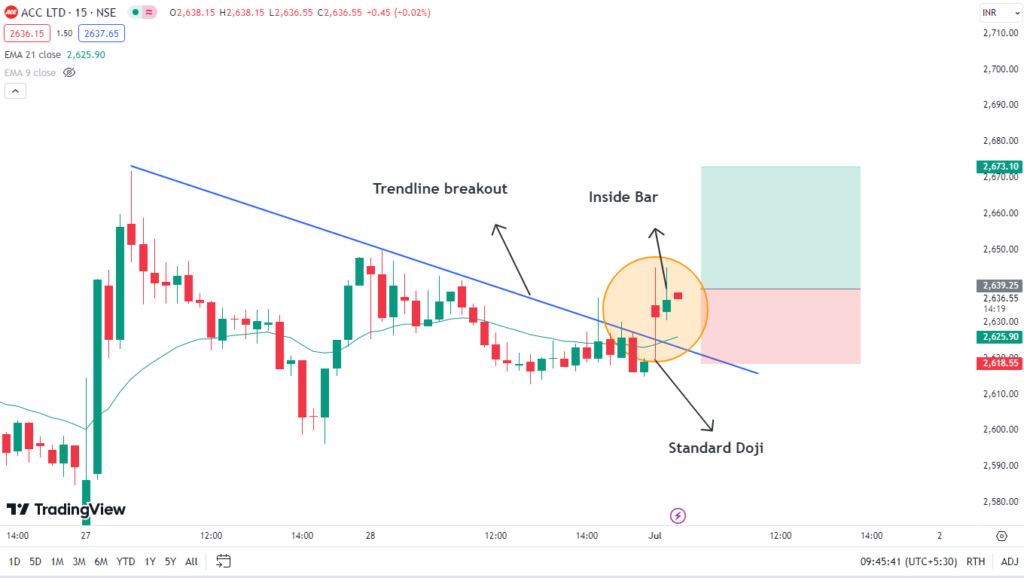
Yeh chart ACC Ltd ke 15-minute time frame ko dikhata hai. Chart pe kuch important cheezein highlight ki gayi hain:
- Trendline Breakout: Ek descending trendline thi jise price ne break kiya hai. Jab price ne is trendline ko upar ki taraf toda, toh yeh ek bullish signal hota hai ki shayad price aur upar ja sakta hai.
- Inside Bar: Trendline breakout ke baad ek inside bar bana. Inside bar ka matlab hai ki current candle ka high aur low previous candle ke high aur low ke beech hai. Yeh consolidation ya market indecision ko dikhata hai.
- Standard Doji: Inside bar ke saath ek standard doji bhi bani hai, jo dikhata hai ki buying aur selling pressure mein balance hai. Doji candles ka matlab hota hai ki market unsure hai ki agla move kis direction mein hoga.
Chart pe exponential moving averages (EMAs) bhi dikhai de rahe hain:
- EMA 21 (Green Line): Current price ke niche hai, jo thoda bullish bias ko dikhata hai.
- EMA 9 (Red Line): Short-term trend ko follow karta hai aur price ke kareeb hai.
Chart pe upar aur niche shaded areas bhi dikhaye gaye hain jo potential profit (green) aur loss (red) zones ko represent karte hain. Yeh trade setup ka ek visual representation hai, jahan green area potential target hai aur red area stop-loss hai.
In summary, yeh chart ek bullish setup ko dikhata hai jahan trendline breakout, inside bar, aur standard doji candles nazar aa rahi hain, jo potential upward move ko indicate karte hain.
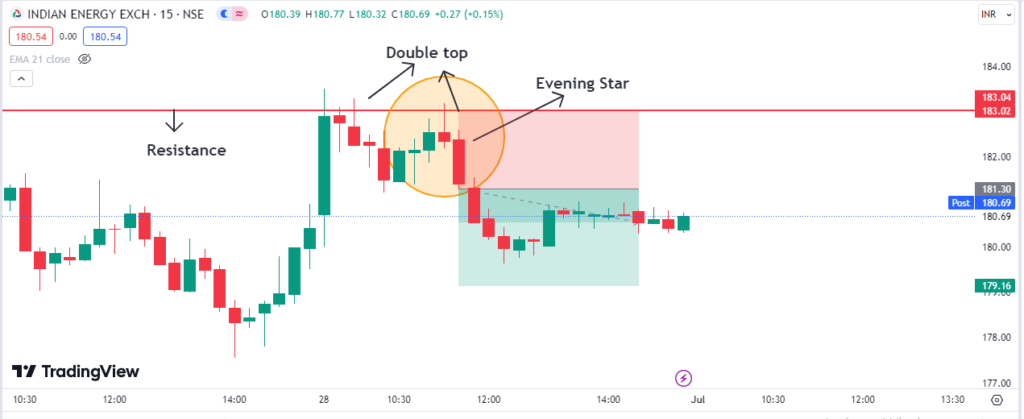
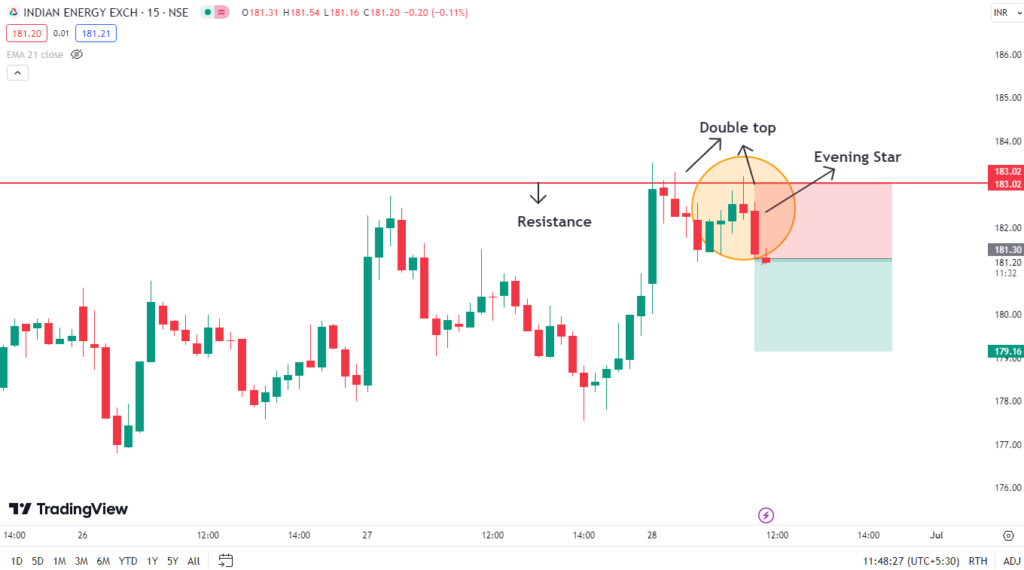
Yeh chart Indian Energy Exchange (IEX) ka hai, jo 15-minute timeframe pe dikhaya gaya hai. Chart mein kuch important technical patterns highlight kiye gaye hain:
- Resistance: Red horizontal line resistance level ko dikhata hai, jo approximately 183 ke aas-paas hai. Yeh wo level hai jahan se price pehle baar girti thi.
- Double Top: Orange circle ke andar dikhaya gaya hai. Double top ek bearish reversal pattern hota hai jo is baat ka indication deta hai ki price potentially niche ja sakti hai. Yeh pattern tab banta hai jab price do baar resistance level ko touch karke wapas niche aati hai.
- Evening Star: Yeh ek bearish candlestick pattern hota hai jo trend reversal ka indication deta hai. Is pattern mein teen candles hoti hain: pehli ek large bullish candle, doosri ek small-bodied candle (jo color ho sakti hai), aur teesri ek large bearish candle.
Chart ke hisaab se, price ne resistance level par double top banaya aur phir evening star pattern form kiya, jo is baat ka signal hai ki price potentially niche jaane wali hai. Ab price approximately 181.10 par trade ho rahi hai.
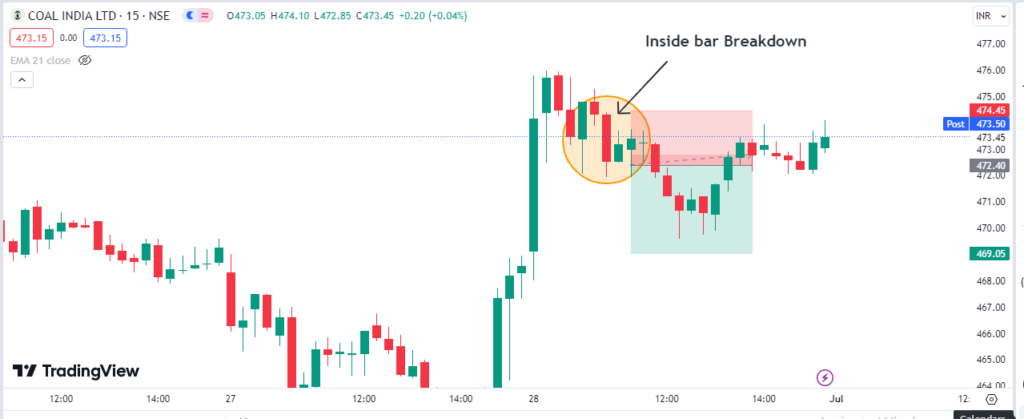
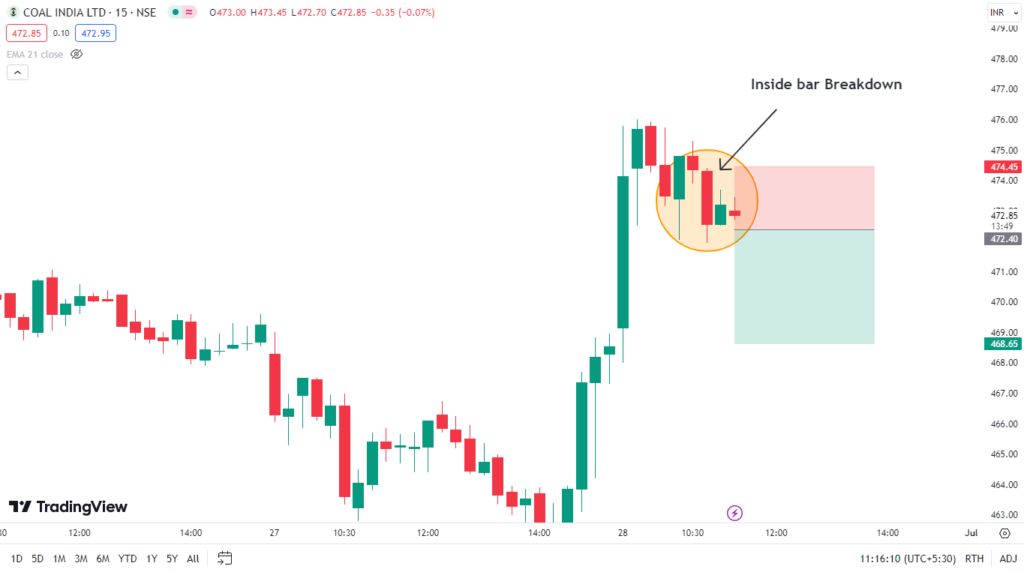
Yeh chart Coal India Ltd. ka hai, jo 15-minute time frame pe hai, NSE (National Stock Exchange) ka. Chart par kuch important points highlight kiye gaye hain:
- Inside Bar Breakdown: Orange circle ke andar inside bar breakdown dikhayi de rahi hai. Inside bar breakdown tab hota hai jab ek chhoti candle (inside bar) previous badi candle (mother bar) ke range ke andar close hoti hai aur phir agle candle ke saath niche breakout karti hai. Yeh ek bearish signal hota hai.
- Price Movement: Chart pe price pehle uptrend mein tha, lekin inside bar breakdown ke baad price niche girne laga. Yeh dikhata hai ki upar wale levels pe selling pressure strong tha.
- Trade Setup: Red highlighted area stop loss hai agar price upar jata hai, aur green highlighted area potential target hai agar price niche jata hai.
Yeh chart ek potential bearish setup dikhata hai jaha inside bar breakdown ke baad price niche ja sakta hai.
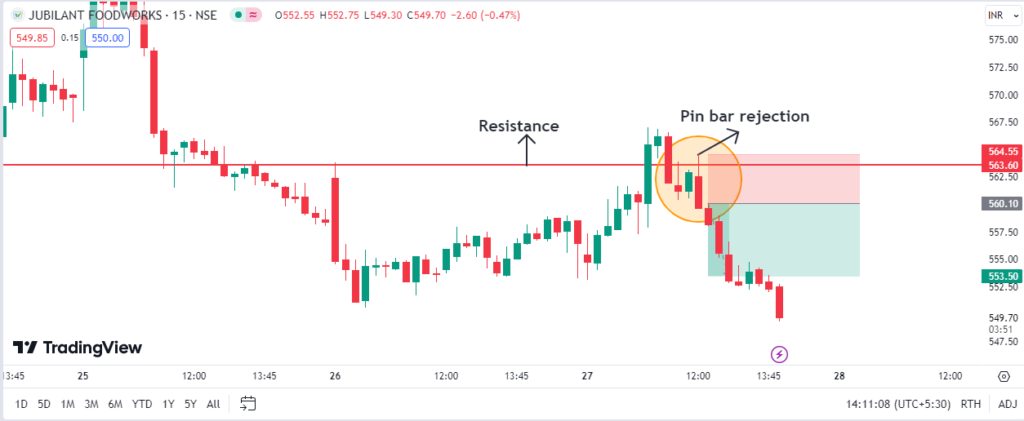
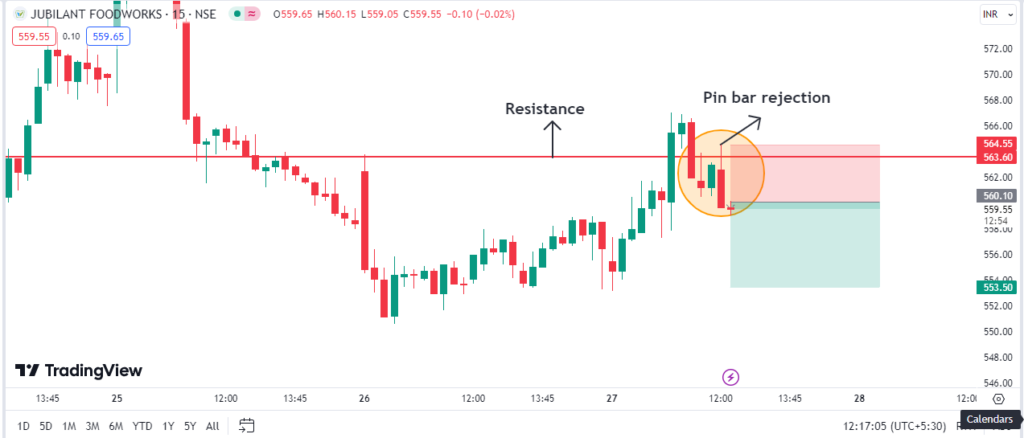
Yeh chart Jubilant Foodworks Ltd. ka hai, jo 15-minute time frame pe hai, NSE (National Stock Exchange) ka. Chart par kuch important points highlight kiye gaye hain:
- Resistance Level: Red horizontal line resistance level dikhati hai. Yeh level pehle support tha jo ab resistance ban gaya hai. Price ne is level ko paar karne ki koshish ki, lekin wapas neeche aaya.
- Pin Bar Rejection: Orange circle ke andar pin bar dikhayi de rahi hai. Pin bar ek bearish candlestick pattern hai jisme chhoti body aur lambi upper wick hoti hai. Yeh indicate karta hai ki upar wale levels pe selling pressure strong tha, isliye price wapas neeche aaya.
- Price Movement: Chart pe price pehle downtrend mein tha, lekin support level pe aane ke baad wapas upar move kiya. Lekin resistance level pe aane ke baad wapas neeche aane laga.
- Trade Setup: Green highlighted area potential target hai agar price neeche jata hai, aur red highlighted area stop loss hai agar price upar jata hai.
Yeh chart ek potential bearish setup dikhata hai jaha resistance level aur pin bar rejection ke baad price neeche ja sakta hai.
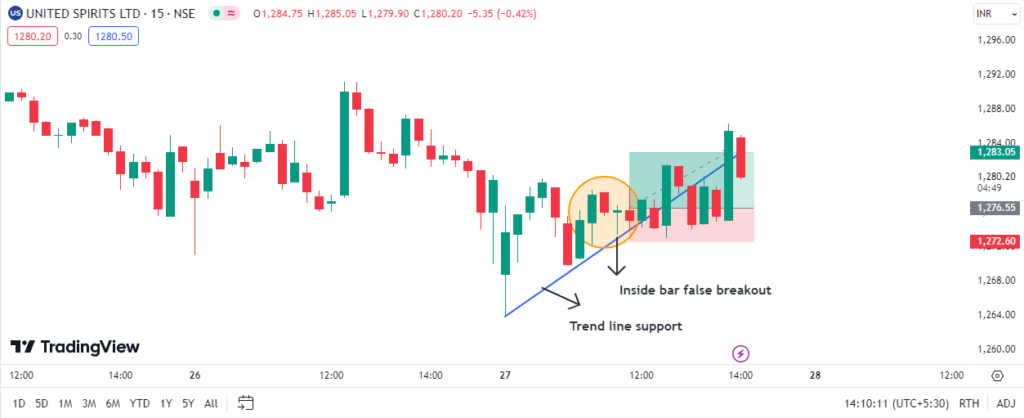
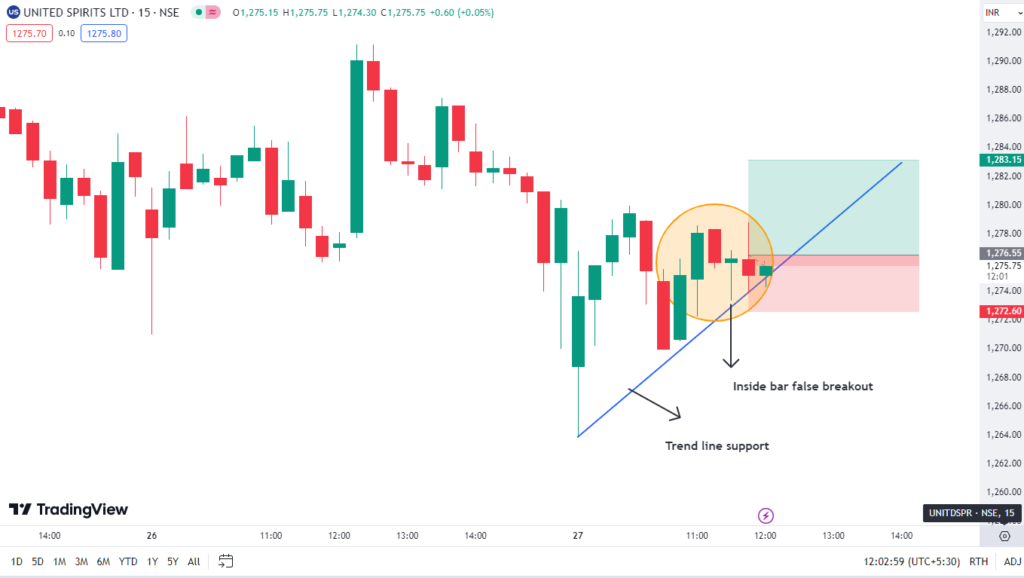
Yeh chart United Spirits Ltd. ka hai, jo 15-minute time frame pe hai, NSE (National Stock Exchange) ka. Chart par kuch important points highlight kiye gaye hain:
- Trend Line Support: Ek blue upward sloping line draw ki gayi hai jo trend line support dikhati hai. Price ne is line ko touch karke wapas upar move kiya hai.
- Inside Bar False Breakout: Orange circle ke andar ek inside bar dikhayi de rahi hai jisme pehle ek red candle bani aur uske baad green candle bani jo uske andar hi close hui. Yeh false breakout dikhata hai, jisme price ne pehle neeche jaane ka try kiya lekin wapas upar aagaya.
- Price Movement: Chart pe dekh sakte hain ki price pehle downtrend mein tha, lekin trend line support pe aane ke baad wapas upar move kiya. Yeh suggest karta hai ki support strong hai aur price phir se upar jaane ki koshish kar raha hai.
- Trade Setup: Green highlighted area potential target hai agar price upar jata hai, aur red highlighted area stop loss hai agar price neeche jata hai.
Yeh chart ek potential bullish setup dikhata hai jaha trend line support aur inside bar false breakout ke baad price upar ja sakta hai.
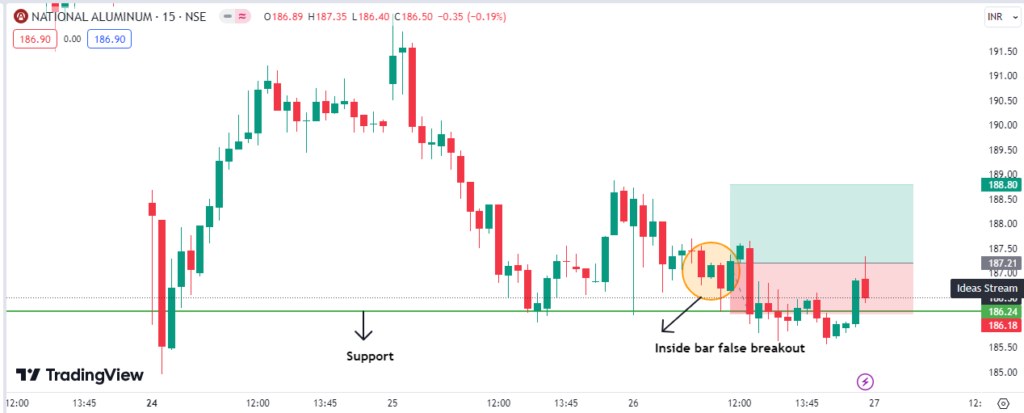
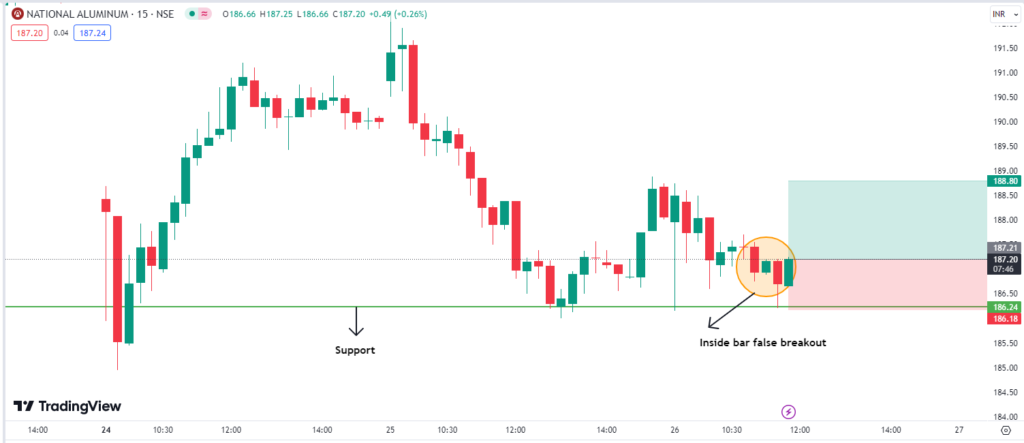
Yeh chart National Aluminium Ltd ka 15-minute interval par banaya gaya hai. Isme kuch important points highlight kiye gaye hain:
- Support Level: Ek horizontal line support level ko indicate karti hai. Price is level pe aake pehle support le chuki hai aur abhi bhi is level pe price ne support liya hai.
- Inside Bar False Breakout: Orange circle ke andar ek inside bar false breakout dikhaya gaya hai. Inside bar false breakout ka matlab hota hai ki pehle candle ke andar wali candle ki range me breakout hua, lekin phir price wapas andar aa gayi.
- Price Movement: Green candles price rise ko aur red candles price fall ko dikhati hain. Chart me dekh sakte hain ki pehle price rise hui thi, phir fall hui aur support level pe aake wapas rise hone lagi.
- Trading View: Yeh chart bhi TradingView platform par banaya gaya hai, jo traders ke liye technical analysis ka ek popular tool hai.
Is chart se yeh samajh aata hai ki price ne support level pe aake wapas rise karne ki koshish ki, lekin inside bar ka false breakout hua, jiska matlab hai ki price ko resistance mila aur abhi bhi uncertain hai ki aage ka trend kya hoga. Traders isse dekhkar future price movement ka andaza laga sakte hain aur accordingly trading decisions le sakte hain.
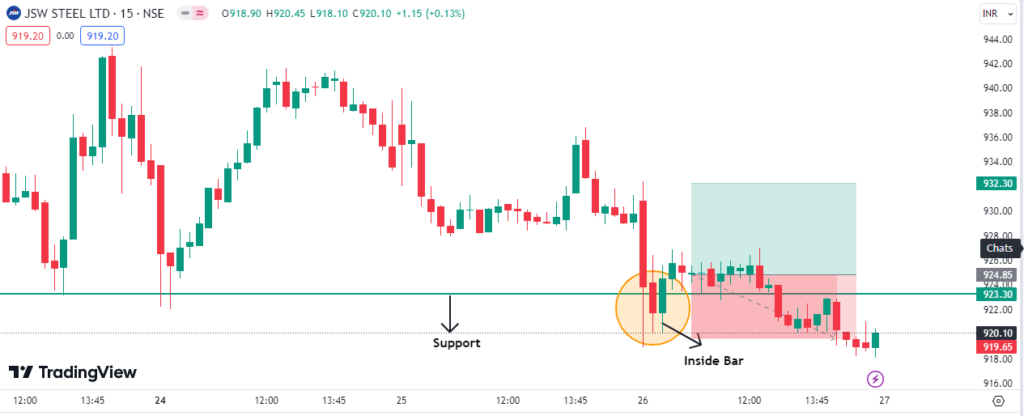
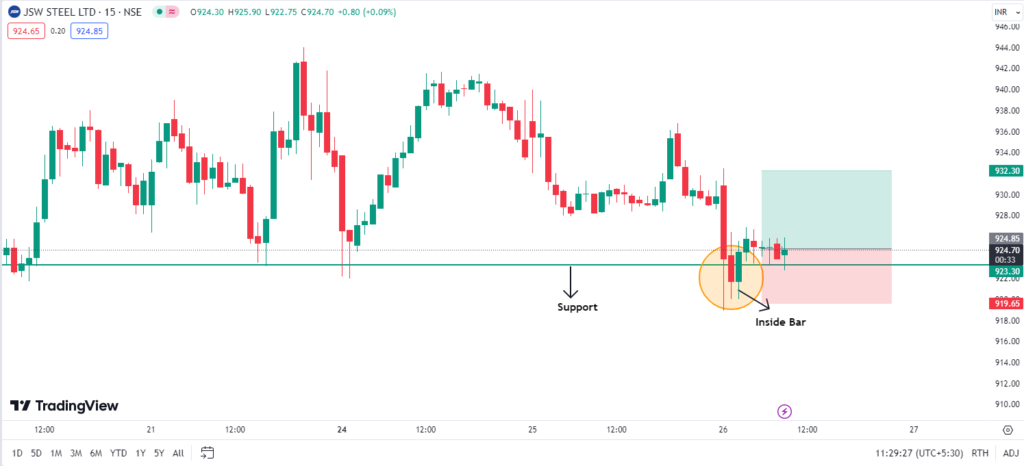
Ye chart JSW Steel Ltd ka 15-minute interval par banaya gaya hai. Chart pe kuch important features hain:
- Support Level: Ek horizontal line draw ki gayi hai jo support level ko indicate karti hai. Yaha price ne pehle support liya tha, aur phir se is level pe aake support liya hai.
- Inside Bar: Ek inside bar dikhaya gaya hai jo ek orange circle me highlight kiya gaya hai. Inside bar ka matlab hota hai ki current candle ki range, previous candle ki range ke andar hai. Ye market consolidation ko indicate karta hai.
- Price Movement: Chart me green candles price rise ko aur red candles price fall ko dikhati hain. Price pehle fall hui, phir support level pe aake wapas rise hui.
- Trading View: Ye chart TradingView platform pe banaya gaya hai, jo ek popular tool hai technical analysis ke liye.
Is chart se traders ko yeh samajh aata hai ki price support level pe aake phir se rise hone ki possibility hai, aur inside bar consolidation aur possible breakout ko indicate karta hai.
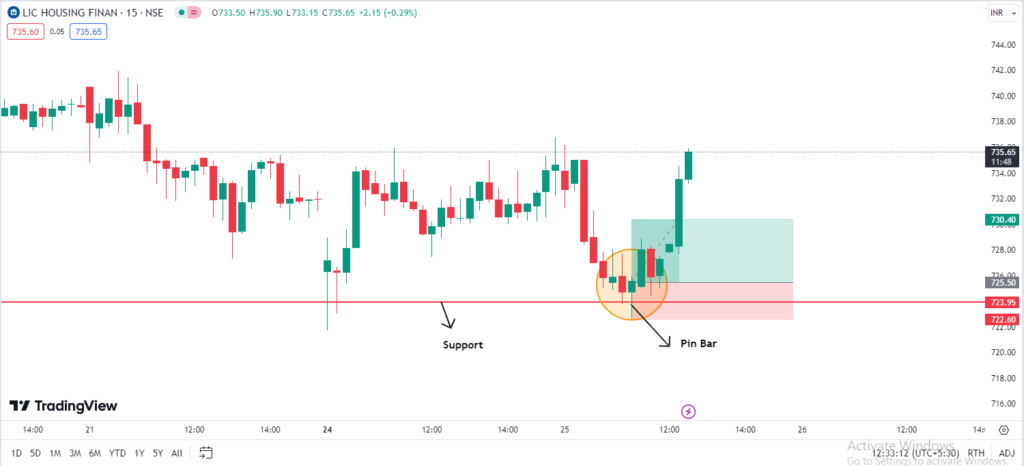
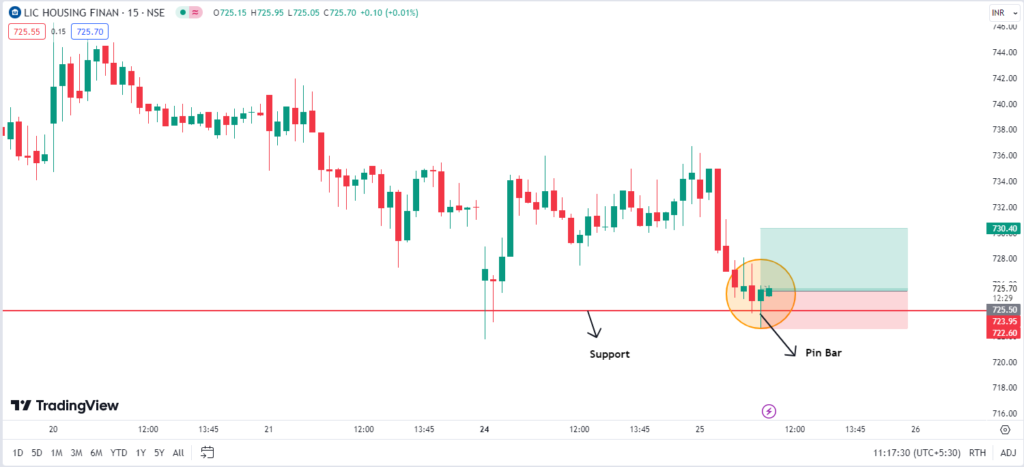
Ye chart LIC Housing Finance ka hai, jo 15-minute interval par trading activity dikhata hai. Is chart par kuch important cheezon ka zikr hai:
- Support Line: Chart par ek horizontal line draw hui hai jo “Support” level ko indicate kar rahi hai. Support level wo point hai jahan pe price aksar gir ke wapas uthti hai.
- Pin Bar: Chart par ek specific candle stick highlighted hai aur usko “Pin Bar” bola gaya hai. Pin bar ek reversal signal hota hai, jo indicate karta hai ki market ka trend badalne wala hai.
- Entry Point: Is pin bar ke baad price ne support level ko touch kiya aur wapas upar chali gayi. Yeh ek buying signal ho sakta hai, isliye green box ko target aur red box ko stop-loss ke taur pe dikhaya gaya hai.
- Green Box: Yeh aapka potential profit area hai.
- Red Box: Yeh aapka stop-loss area hai, jahan aapko loss accept karna padega agar price wapas neeche girti hai.
Summary mein, yeh chart ek potential buying opportunity ko highlight kar raha hai, jahan pin bar aur support level ka combination ek bullish signal de raha hai. Is case mein, trader expect kar sakta hai ki price support level se bounce karegi aur upar jayegi.
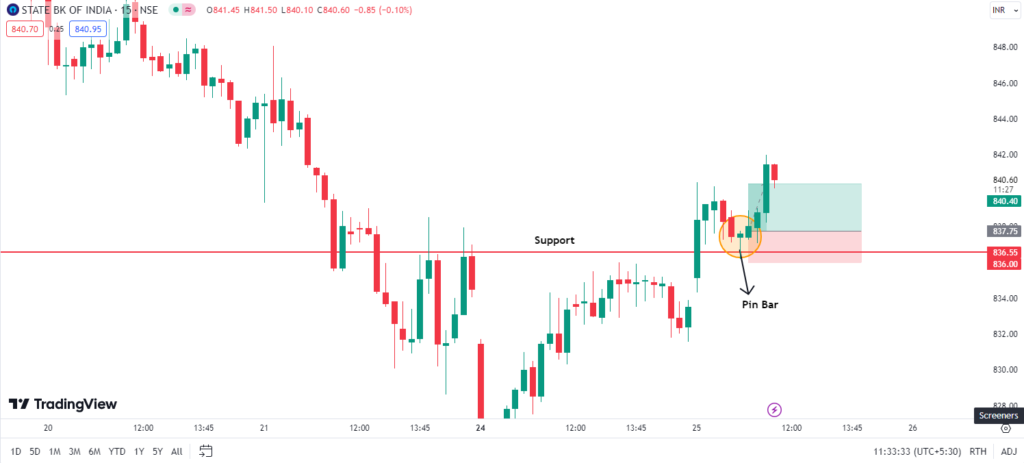
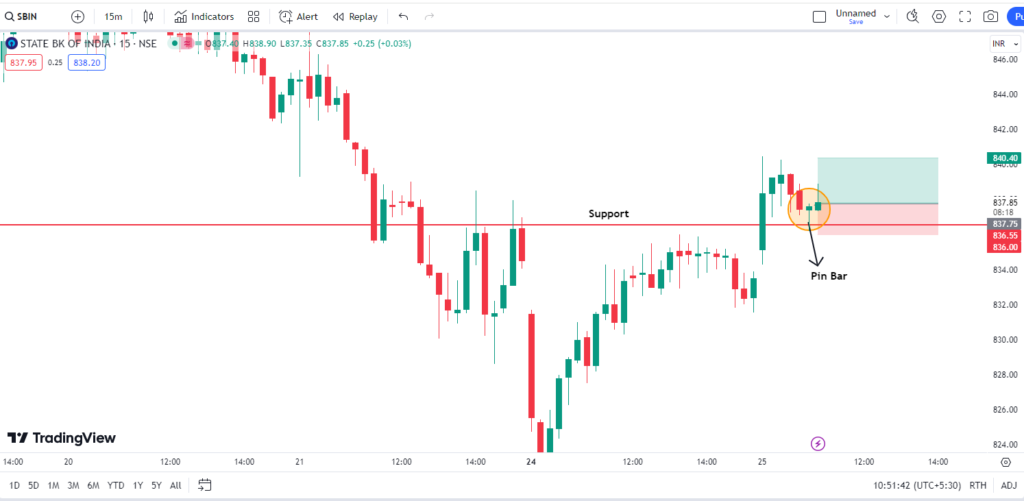
Ye chart State Bank of India (SBIN) ka hai, jo 15-minute interval par trading activity dikhata hai. Yahan kuch important cheezon ka zikar hai:
- Support Line: Chart par ek horizontal line draw hui hai, jo “Support” level ko indicate kar rahi hai. Support level wo point hai jahan pe price aksar gir ke wapas uthti hai.
- Pin Bar: Chart par ek specific candle stick highlighted hai aur usko “Pin Bar” bola gaya hai. Pin bar ek reversal signal hota hai, jo indicate karta hai ki market ka trend badalne wala hai.
- Entry Point: Is pin bar ke baad price ne support level ko touch kiya aur wapas upar chali gayi. Yeh ek buying signal ho sakta hai, isliye green box ko target aur red box ko stop-loss ke taur pe dikhaya gaya hai.
- Green Box: Yeh aapka potential profit area hai.
- Red Box: Yeh aapka stop-loss area hai, jahan aapko loss accept karna padega agar price wapas neeche girti hai.
Summary mein, yeh chart ek potential buying opportunity ko highlight kar raha hai, jahan pin bar aur support level ka combination ek bullish signal de raha hai.
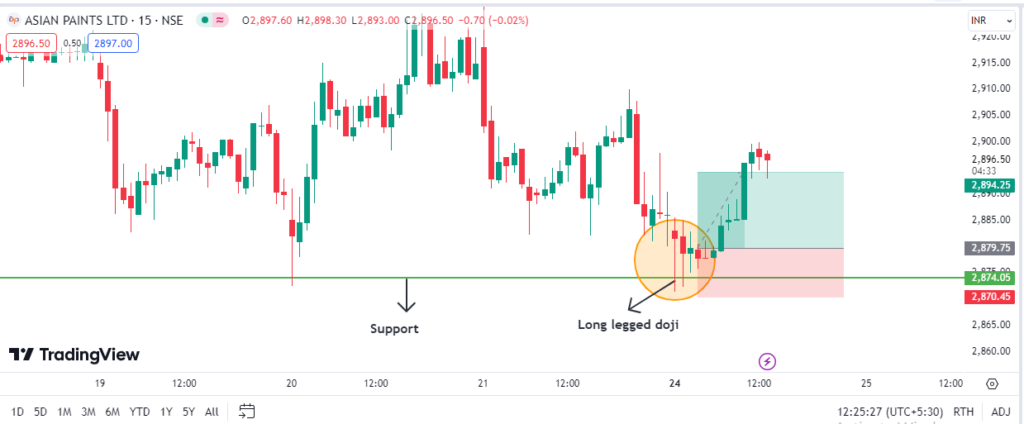
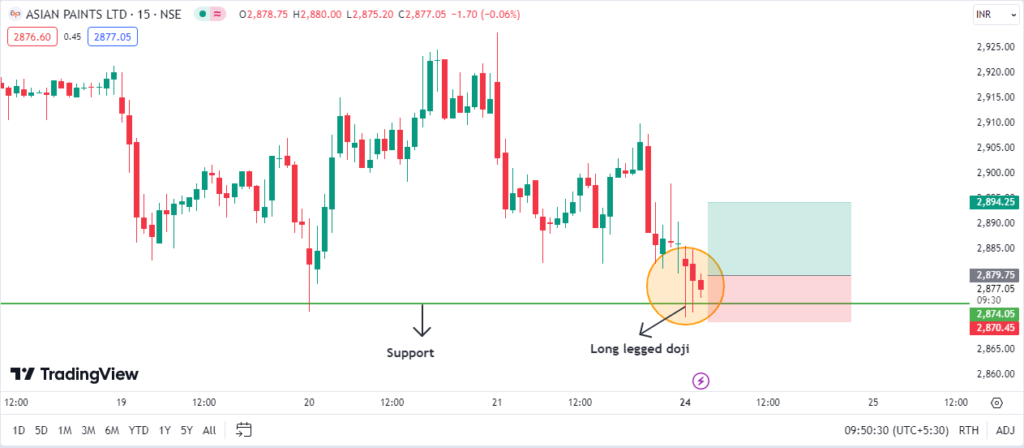
Is chart mein hum Asian Paints Ltd ke 15-minute interval ka stock price movement dekh rahe hain. Yahan kuch important points hain jo highlight kiye gaye hain:
- Support Level:
- Green line support level ko indicate karti hai. Ye woh level hai jahan pehle bhi stock price ne bottom banaya tha aur wapas upar gaya tha. Ye ek important level hota hai jahan buyers wapas active ho sakte hain.
- Long-Legged Doji:
- Ye ek candlestick pattern hai jo dikhata hai ki opening aur closing price almost same hain, lekin high aur low prices kaafi door hain. Iska matlab ye hai ki market mein significant indecision hai. Buyers aur sellers dono active hain, lekin price ko kisi ek direction mein push nahi kar pa rahe.
Is chart ke right side mein hum ek trading setup dekh rahe hain jahan ek potential buy signal ho sakta hai agar price support level se upar jata hai. Buy setup mein:
- Entry point (green box) support level ke thoda upar hota hai.
- Stop loss (red box) support level ke neeche hota hai.
- Target (upper boundary of the green box) potential profit area ko indicate karta hai.
Yadi stock price support level se rebound karti hai aur upar jati hai, toh buy signal confirm ho sakta hai. Lekin agar price support level ke neeche jati hai, toh stop loss hit ho sakta hai aur loss minimize karne ke liye position close ki jati hai.

